The Dirtiest Hours of the Year
Part 3 of 3 · The Thermal Series
Nearly all the fossil generation in the Northwest sits in a handful of winter hours. Which means nearly all the emissions do too, and almost none of our measurement tools can see it.
By Jeff Nichols
If you drew a chart of every hour in a year, ordered from the hour your region used the most electricity to the hour it used the least, you would get a shape that grid planners call a load duration curve. It starts high on the left, drops fast, and then flattens into a long tail that runs most of the way across the page.
That shape explains more about energy policy than almost anything else I could put in front of you, and almost nobody outside the industry has seen it.
The important part isn’t the flat tail. It’s the first few dozen hours on the left, and what we burn to serve them.
The shape of the problem
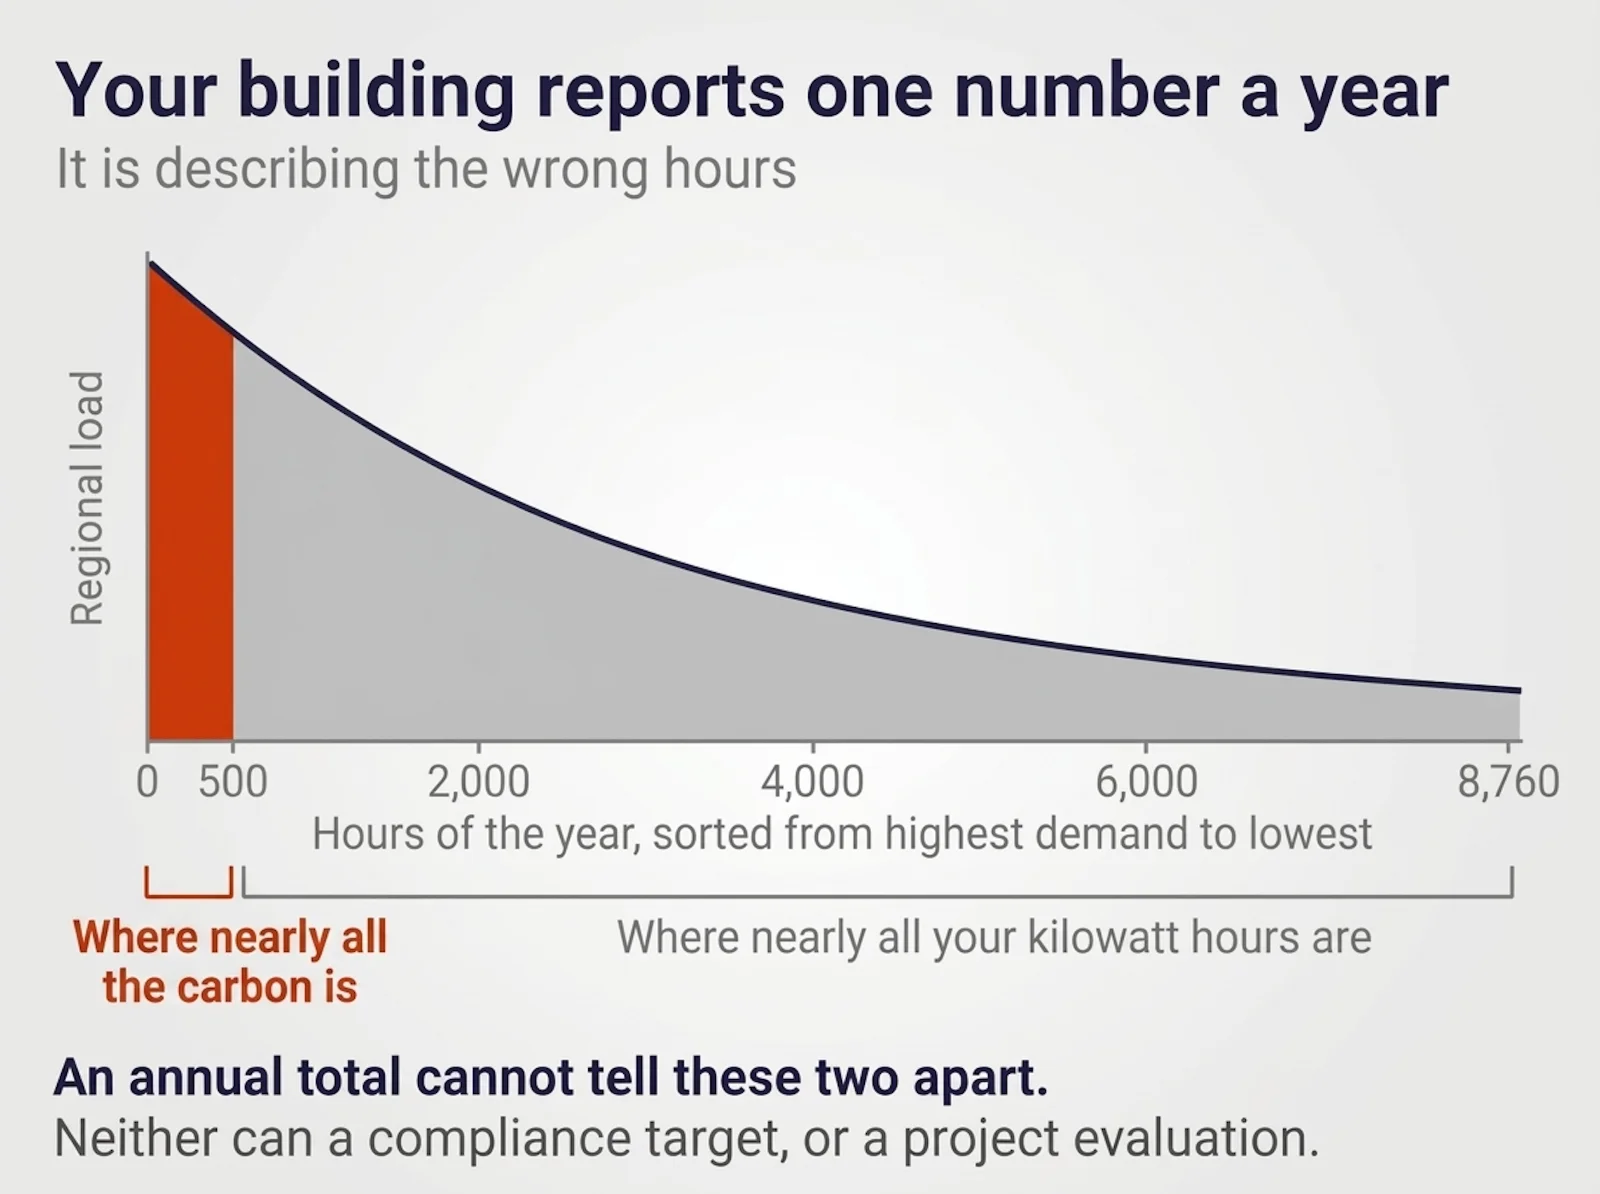
Most of the year, the Northwest power system is comfortable. Hydropower covers the load, there’s surplus to export, and prices are low. That’s the long flat part of the curve, and it covers something like 95% of the hours in a year.
Then there are the hours on the left edge.
The Northwest has always been a winter-peaking system. Regional loads run highest during cold snaps on December and January mornings and evenings, when heating demand, lighting demand, and everything else stack up in the same few hours. Seattle City Light's own planning documents mark the winter peak at hour 18, which is to say 6pm.
Those hours are a small fraction of the year, but they’re also the hours that determine what the region has to build, what it has to buy, and what it emits doing it.
What actually serves them
Here’s the part that surprises people. A survey of integrated resource plans across Northwest utilities found that most utilities expect to meet a significant portion of their peak capacity requirements through front office transactions. That’s the industry term for buying power on the open market rather than generating it.
For most utilities, the answer to "what serves the Northwest peak" isn’t a power plant they own, it’s a purchase. And what they’re purchasing during a regional cold snap, when every utility in the footprint is short at the same moment, is whatever thermal generation the market can dispatch.
Seattle City Light's fuel disclosure describes this plainly. The utility holds no coal or gas resources. Market purchases, including those made through Bonneville, may incidentally include coal or natural gas, and the emissions from those purchases are offset under the utility's greenhouse gas neutrality policy.
The clean portfolio is real. So are the market purchases during the hours the portfolio can’t cover.
Why a few hours matter this much
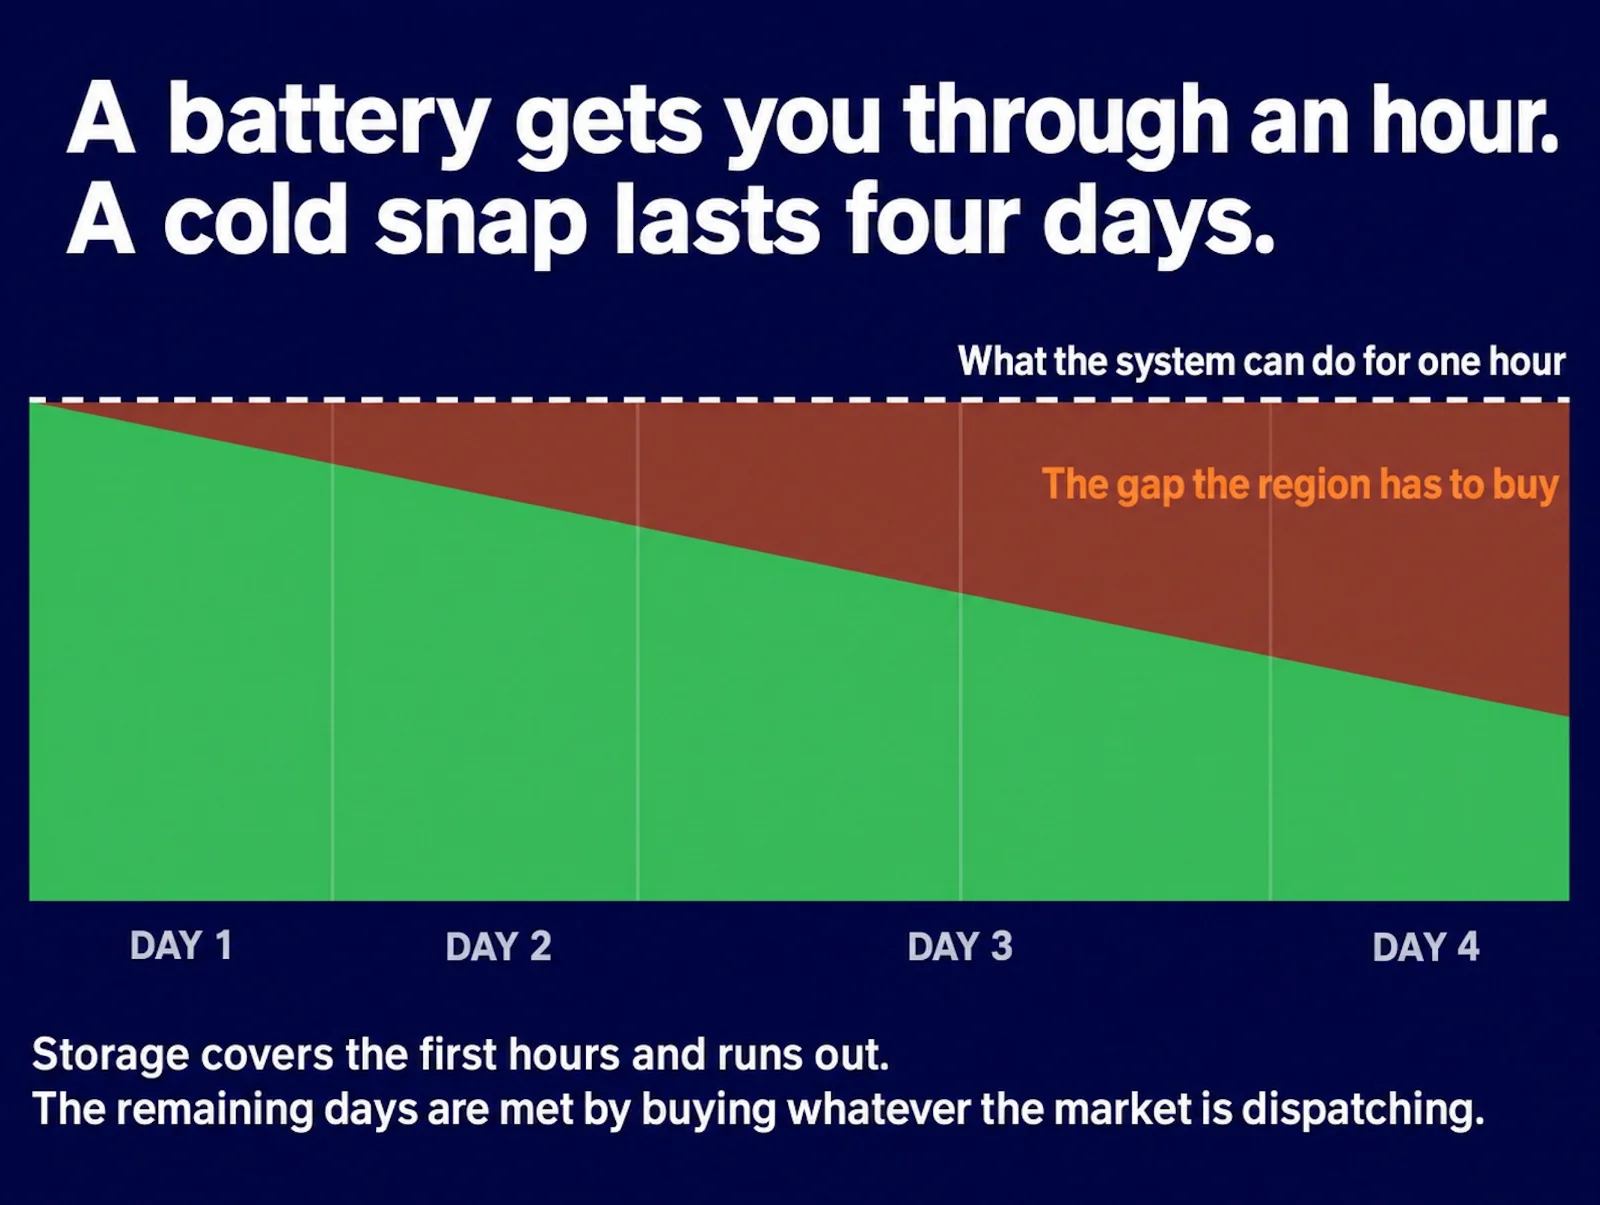
There’s a planning concept here that’s worth understanding, because it reframes the whole problem. The Council's power plans make the point that the Northwest system can’t sustain its single-hour generating capability over long periods. A hydro system can produce a lot of power for an hour by drawing hard on the reservoirs, but it can’t do that for four days running. So the right measure isn’t peak capability, it’s sustained peak capability, which the Council approximates over a three-day window because that’s roughly how long a regional cold snap lasts.
That distinction is why batteries, which are genuinely useful, don’t solve this problem. A lithium-ion battery carries you through a few hours of peak demand, and a four-day cold snap in a low water year is a different kind of problem entirely.
There is work going on here worth watching. Dawn Lindell pointed me toward copper flow chemistry as one of the more promising long-duration approaches, and the appeal is easy to see. Flow batteries use non-flammable electrolytes, so thermal runaway isn’t a failure mode the way it is with lithium-ion, which matters when the thing you are specifically designing for is temperature extremes. The materials story is friendlier too, since copper sidesteps the cobalt supply question.
The honest caveat is that it is still maturing. Flow chemistry has been around for decades and still lacks the long-term field performance data that would let a utility plan around it. This is a technology to watch rather than one to buy, and in the meantime the region doesn’t have a good answer for the four-day problem.
It’s also why the fossil generation in this region is so concentrated. You don’t build a gas plant to run all year in a hydro system. You build it, or you contract for access to someone else's, to cover the handful of multi-day events when the water isn’t enough.
Which means the economics are strange. A peaking plant that runs a few hundred hours a year has to recover its capital cost across those hours, so the power it produces is expensive per megawatt hour even before you price the fuel. That cost doesn’t show up as a line item on anyone's bill. It’s spread across every kilowatt hour the utility sells, which is another way of saying the flat part of the curve subsidizes the left edge.
The emissions follow the same shape
Which brings us to the thing this series is about. If nearly all the fossil generation in a hydro-dominated region is concentrated in a small number of peak hours, then nearly all the emissions from electricity are concentrated there too.
That has an uncomfortable implication. In a region like this one, the carbon content of a kilowatt hour isn’t a property of the year, it’s a property of the hour. The same kilowatt hour saved in May and saved at 6pm on a January Tuesday aren’t the same thing in carbon terms, and they aren’t close.
However, our tools don’t see this. Benchmarking reports annual energy use, compliance standards set annual targets, and project evaluations multiply annual savings by an annual average emissions factor. Every one of those is blind to the distinction that matters most.
That’s not an accident or an oversight. Annual accounting is enormously easier, the data is available, and for most of the country it’s a reasonable approximation because the generation mix doesn’t swing as hard hour to hour. In a hydro system with a sharp winter peak and heavy reliance on market purchases to cover it, the approximation breaks down in a way it doesn’t elsewhere.
What the peak is made of
One more layer, and it’s the one that sets up the rest of this series. Ask what’s actually driving load during those winter evening hours and the answer is overwhelmingly thermal. Space heating, water heating, and the furnaces, boilers, and heat pumps that turn on when it gets cold and stay on until it warms up.
That’s the loop this series keeps coming back to. The emissions sit in the peak, the peak is driven by heat, and heat is the part of the energy system we talk about least, measure least, and plan for least.
When a district steam plant electrifies, as CenTrio's Western Avenue plant is planning to, that thermal load moves onto the electric grid. It doesn’t stop being thermal load, it just becomes thermal load that shows up in the hour the grid is least able to serve it cleanly.
What a building owner can do with this
You can’t change what generates at 6pm in January, but you can change what your building is asking for at 6pm in January.
Three things, roughly in order of effort.
1. Know whether your building is winter-peaking. Most heated buildings in this region are, and monthly benchmarking data is enough to tell you.
2. Look at what runs during those hours and ask whether it has to. Morning warm-up that finishes before the evening peak is a different load shape than one running through it. Water heating, EV charging and laundry are the loads most people can move without anyone noticing.
3. Treat peak reduction as worth paying for on its own, not as a bonus that comes with efficiency. The grid value and the carbon value are both concentrated in hours that represent a tiny fraction of your annual consumption.
The flat part of the curve is where your bill lives. The left edge is where the carbon lives. They aren’t the same problem and they don’t have the same solution.
Where we fit
Pilotlight is a compliance platform for building performance standards. Most of what the law asks for is annual: total energy use, reported once a year, compared against a target.
The reason the hourly picture matters to us anyway is that the same data collection that satisfies the law is the starting point for the more useful question. An owner who is benchmarking already knows how much energy the building used. Working out when is a much shorter step from there than starting from nothing.
If you aren’t sure which standards apply to your building, our compliance navigator at pilotlight.ai/search will tell you in about a minute, and it’s free.
Sources
- Northwest Power and Conservation Council, Sixth Northwest Conservation and Electric Power Plan, Chapter 3
- Seattle City Light, Environment and power mix disclosure
- Seattle City Light, 2024 Integrated Resource Plan Progress Report
- E3, Resource Adequacy in the Pacific Northwest
- CenTrio, CenTrio Seattle Advances Decarbonization with 25 MW Electric Boiler (October 13, 2026)