Your Power Bill Is Set by Weather You Never Feel
A five day cold snap in January 2024 cost Northwest utilities somewhere between 65 and 100 million dollars. Most of the people who paid for it never knew. Here are the two different ways weather you never experienced ends up on your power bill.
By Jeff Nichols
In January 2024, over the Martin Luther King Jr. holiday weekend, a five day cold snap hit the Northwest. Seattle City Light's annual report puts what other utilities faced that weekend at $65 million to $100 million in wholesale power purchases.
Most of the people paying for that had no idea it was happening. They turned up the heat, the lights stayed on, and the cost showed up months later in a rate case.
That’s normally where the story stops. But I’ve been looking at how wholesale power prices actually move in this region, and the thing that struck me is how often the weather driving your bill is weather you never experienced. Sometimes it is happening six hundred miles south and sometimes it’s happening in Texas, which is not even on our grid.
Those are two completely different mechanisms, and they are worth understanding separately.
The first way: we share a grid
The Western Interconnection covers eleven states, two Canadian provinces, and a piece of Baja California. Inside it, power physically flows between regions, and prices at the major trading hubs move together closely enough that you can watch one and infer the other.
Which means when the West is short, everyone inside that boundary is competing for the same megawatts.
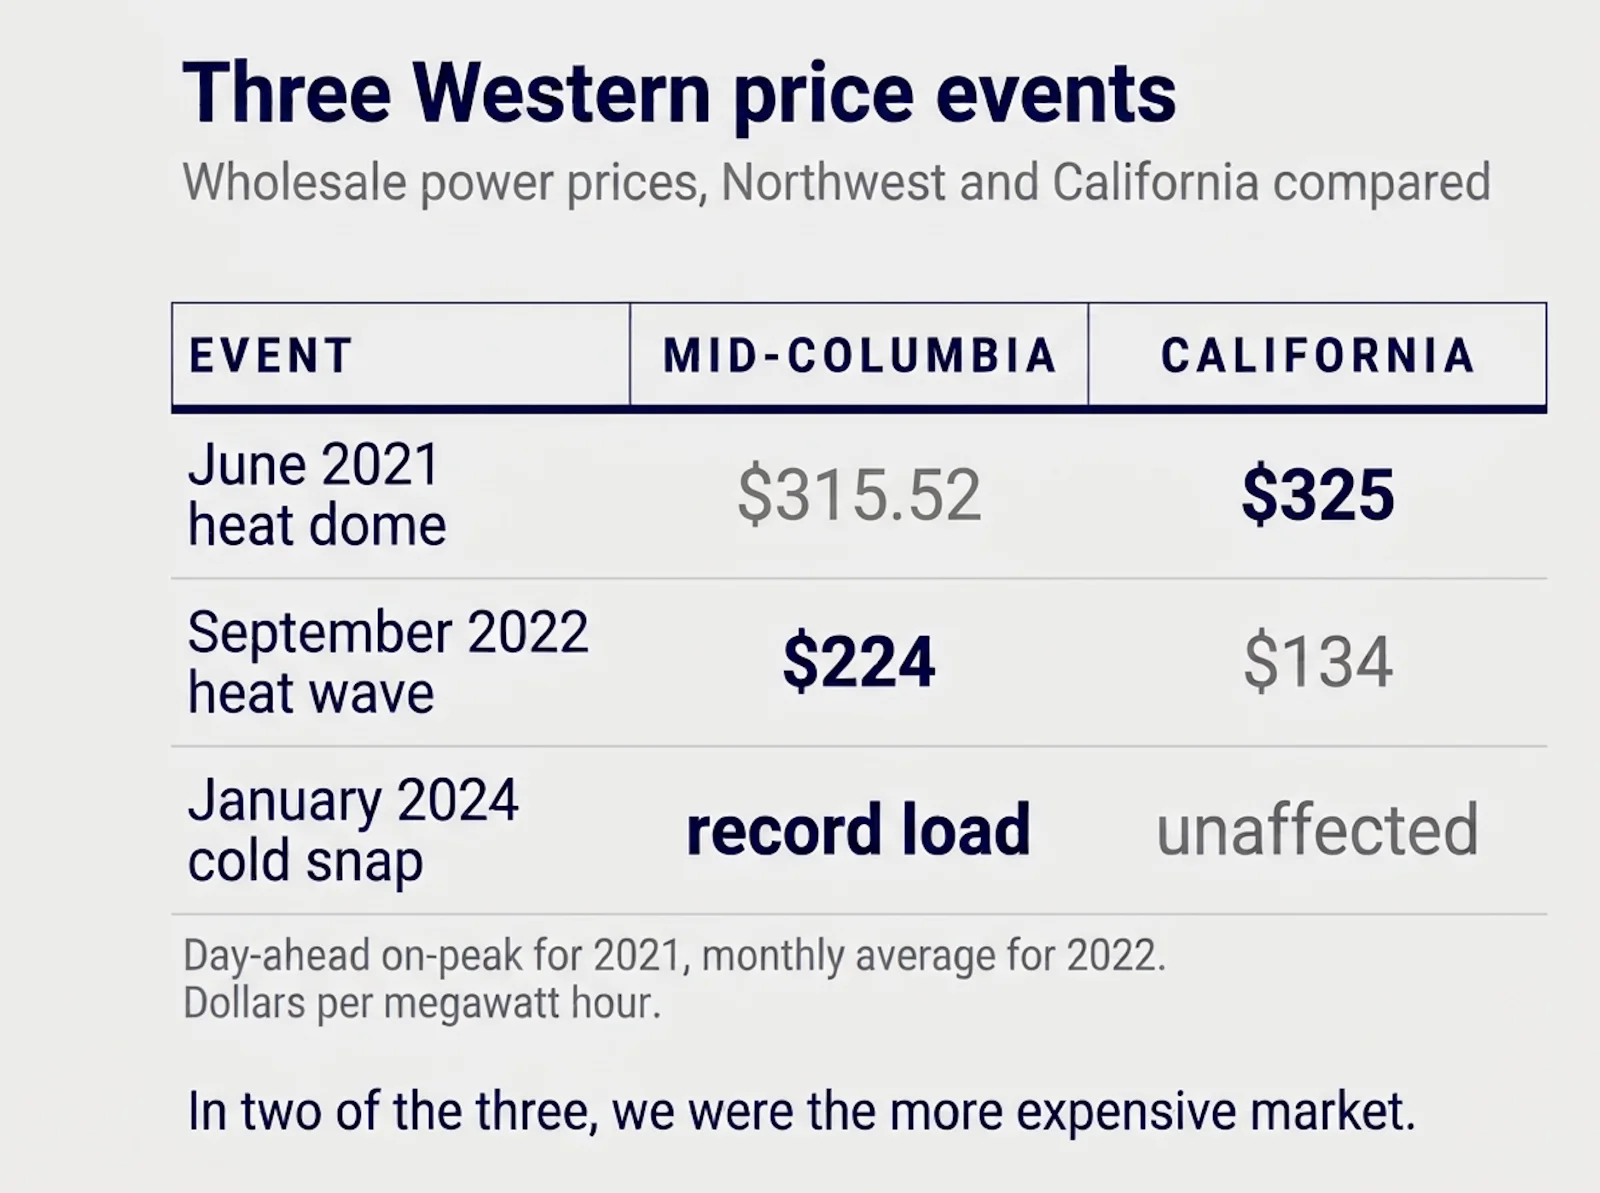
In late June 2021, during the heat dome, Mid-Columbia on peak day ahead prices jumped about 426% in a single day, reaching $315.52 per megawatt hour for June 27 and 28 delivery. The California Oregon Border hub rose 364% to $325, a three year high at the time.
Here’s the part that gets misunderstood, It’s tempting to describe this as California's heat wave raising our prices, as though the problem flows north. However, it doesn’t work that way, and the September 2022 heat wave shows why.
That month, the Mid-Columbia hub in the Northwest averaged $224 per megawatt hour and the California market averaged $134. We were the more expensive market, not the victim of theirs.
Western heat waves are regional events. They arrive across the whole footprint at once, which means our demand spikes at the same moment as everyone else's, and the interconnection that normally lets us buy cheap surplus power suddenly has nothing cheap in it. The connection that helps us most of the year is exactly what exposes us during the hours that matter.
The second way: we share a gas market
Texas is not on our grid. ERCOT is electrically islanded from the rest of the country, which was the entire reason the state could not import its way out of Winter Storm Uri in February 2021.
And yet a deep freeze in Texas moves prices here, it just takes a different route.
When temperatures crash in a producing region, water and hydrates that come up alongside natural gas freeze and solidify, blocking flow at the wellhead and at nearby processing plants. The industry calls these freeze offs. During Uri, Texas natural gas production fell by almost 45%, and between February 8 and 17 the state lost more than 10 billion cubic feet a day. Nationally it was the largest monthly decline in production on record.
Natural gas is a national market. Take that much supply out of it and the price moves everywhere.
During Uri, the benchmark Henry Hub price nearly doubled to about $6.12 per million BTU. That’s the number most coverage reported, but less reported was what happened out here: at many Western hubs, even the lowest trades of the day were in triple digits.
So: Texas weather, Northwest bill. Not through wires, through molecules.
But it doesn’t fire every time
Here’s where I have to complicate my own argument, because the most recent example cuts the other way and it is worth understanding why.
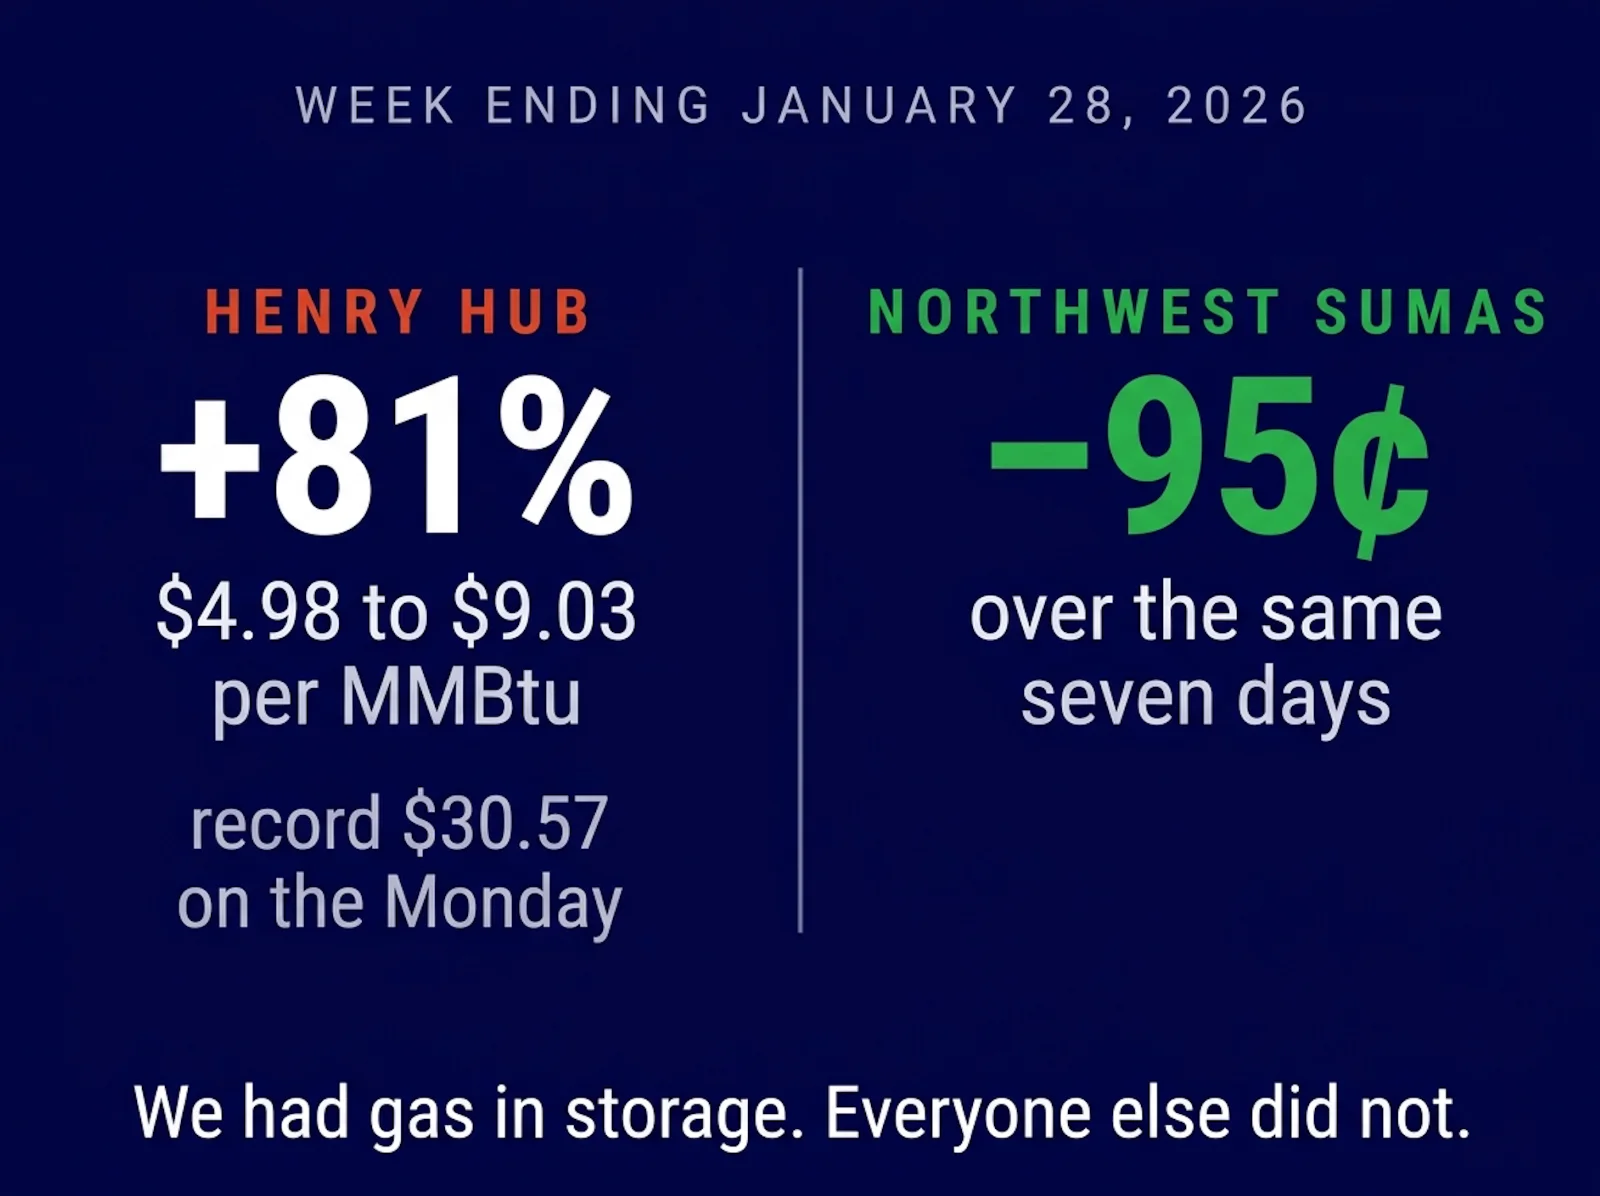
In January 2026, Winter Storm Fern put sub-freezing temperatures across much of the country. In the week ending January 28, the Henry Hub benchmark rose from $4.98 to $9.03 per million BTU, an 81% move in seven days, and hit a record nominal high of $30.57 on the Monday. The Transco Zone 6 hub serving New York City reached $142.72, also a record.
Over the same week, the price at Northwest Sumas went down 95 cents.
The Energy Information Administration's own explanation is in its storage data. Working gas inventories were tight across most of the country that week, and above average in the Pacific region. We had gas in the ground, but everyone else did not.
Worth knowing how temporary that protection is. In the week ending January 30, net withdrawals from storage nationally hit 360 billion cubic feet against a five-year average of 190, the largest single week in EIA's records going back to 2010. National inventories went from 6% above the five-year average in mid-January to 1% below it two weeks later. Henry Hub came back down to $6.44.
One storm consumed the cushion, which is the thing to hold on to: a buffer is not the same as a surplus, and the protection that kept Northwest prices down in January was an inventory rather than an advantage.
That is the thing worth taking from both halves of this post. Neither mechanism is a law of physics that transmits distant weather to your bill automatically. Both are conditional on the same thing, which is whether this region happens to be short at the same moment somebody else is.
When we have water in the reservoirs and gas in storage, a crisis elsewhere stays somebody else's crisis. When we don’t, we’re bidding against them with nothing of our own to fall back on. The January 2024 cold snap was expensive because it was cold here as well. Uri reached us because the whole West was drawing on a national gas market that had just lost a fifth of its supply at the same moment. Distance, in other words, is not really the variable.
Simultaneity is.
Why the Northwest is unusually exposed
Two features of this region make both mechanisms bite harder here than they would elsewhere.
The first is hydropower. The Northwest Power and Conservation Council puts it at about 50% of the region's annual generation and 54% of its flexible capacity, meaning more than half of our ability to ramp output up and down quickly comes from water.
That is a genuine advantage in most years and a specific vulnerability in dry ones, because both halves of that sentence fail at the same time. A low water year gives the region less of its own generation to lean on, and it also takes away some of the flexibility the region uses to follow demand through a cold evening. So we buy more, at exactly the moment everyone else is also buying.
And dry years are not rare. Northwest hydropower generation hit a two decade low in the 2023 water year, and across the West output in 2022 and 2023 was down about 11% from 2021. The pattern the agencies expect going forward is higher winter flows, earlier spring runoff, and longer stretches of low water in late summer, which is a description of less water in the reservoir during the months we most need to draw on it.
The second is that we are a shoulder market. The Northwest has historically exported surplus power south in summer and imported during winter cold snaps. That arrangement works beautifully when our peak and California's peak happen at different times. It works badly when a heat dome parks over the entire West Coast for a week.
Why this gets worse before it gets better
Everything above describes the system as it stands, but demand is not standing still.
The Pacific Northwest Utilities Conference Committee projects regional electricity demand rising about 25% within a decade. Bonneville expects data centers alone to more than double their electricity demand across Oregon and Washington over the next two decades.
That matters for this post specifically, not just in general. Price spikes happen when demand runs up against available supply during a narrow window. Adding load without adding supply does not move that threshold a little, it moves how often the region crosses it. The same heat dome that produced a three year high in 2021 produces a worse number against a load that is a quarter larger.
I want to be careful about where that leads, though, because data centers are getting blamed for something they did not do.
The story people have settled on is that data centers are taking all the power and driving up everyone's bills. Look at what actually moved prices in the events in this post. A heat dome. A five day freeze. A cold snap in a low water year. Those are weather events, and there are going to be many more of them. Dawn Lindell made this point when I spoke with her, and in her experience most of the load growth she has dealt with has been transportation electrification, building electrification, and ordinary local growth, rather than server halls.
The more interesting version of the argument runs the other way. A data center is a large customer with capital, a long time horizon and a direct interest in grid reliability. If utilities and the communities hosting them engage seriously rather than treating them as something to be endured, those customers can more than pay for the infrastructure the region needs anyway. They can fund transmission that would otherwise wait a decade for a rate case.
That is not an argument for approving every project that files. It is an argument that we are having the wrong fight. The thing raising your bill in the hours this post is about is weather, and the thing that could help pay to fix it is being treated as the problem.
What is changing
The West is in the middle of restructuring how it trades power, and it is going in two directions at once.
The Extended Day Ahead Market, run by California's grid operator, went live on May 1, 2026. A competing day ahead market called Markets+, run by Southwest Power Pool, is expected to start in early 2027. Bonneville, which controls roughly three quarters of this region's transmission, has recommended joining Markets+.
The case for a day ahead market is straightforward. The existing real time imbalance market has delivered billions of dollars in cumulative benefits by letting utilities trade surplus across a wider footprint. Extending that to the day ahead timeframe should capture more of the same.
The case against splitting the West into two of them is also straightforward. Two markets means two sets of rules, and seams between them where trades get more expensive and less efficient. A region whose core vulnerability is being short at the same time as its neighbours is a region with a specific interest in those neighbours being easy to trade with.
I’m not going to pretend to know which way that should go. It’s a live and genuinely contested question, and the people arguing both sides are serious. But it’s worth knowing it’s happening, because the outcome will shape what your utility pays during exactly the hours this post is about.
What a building owner can actually do
The honest answer to "what should a building owner do about Western gas markets" is nothing, because none of it is in your control. But two things follow from understanding it anyway.
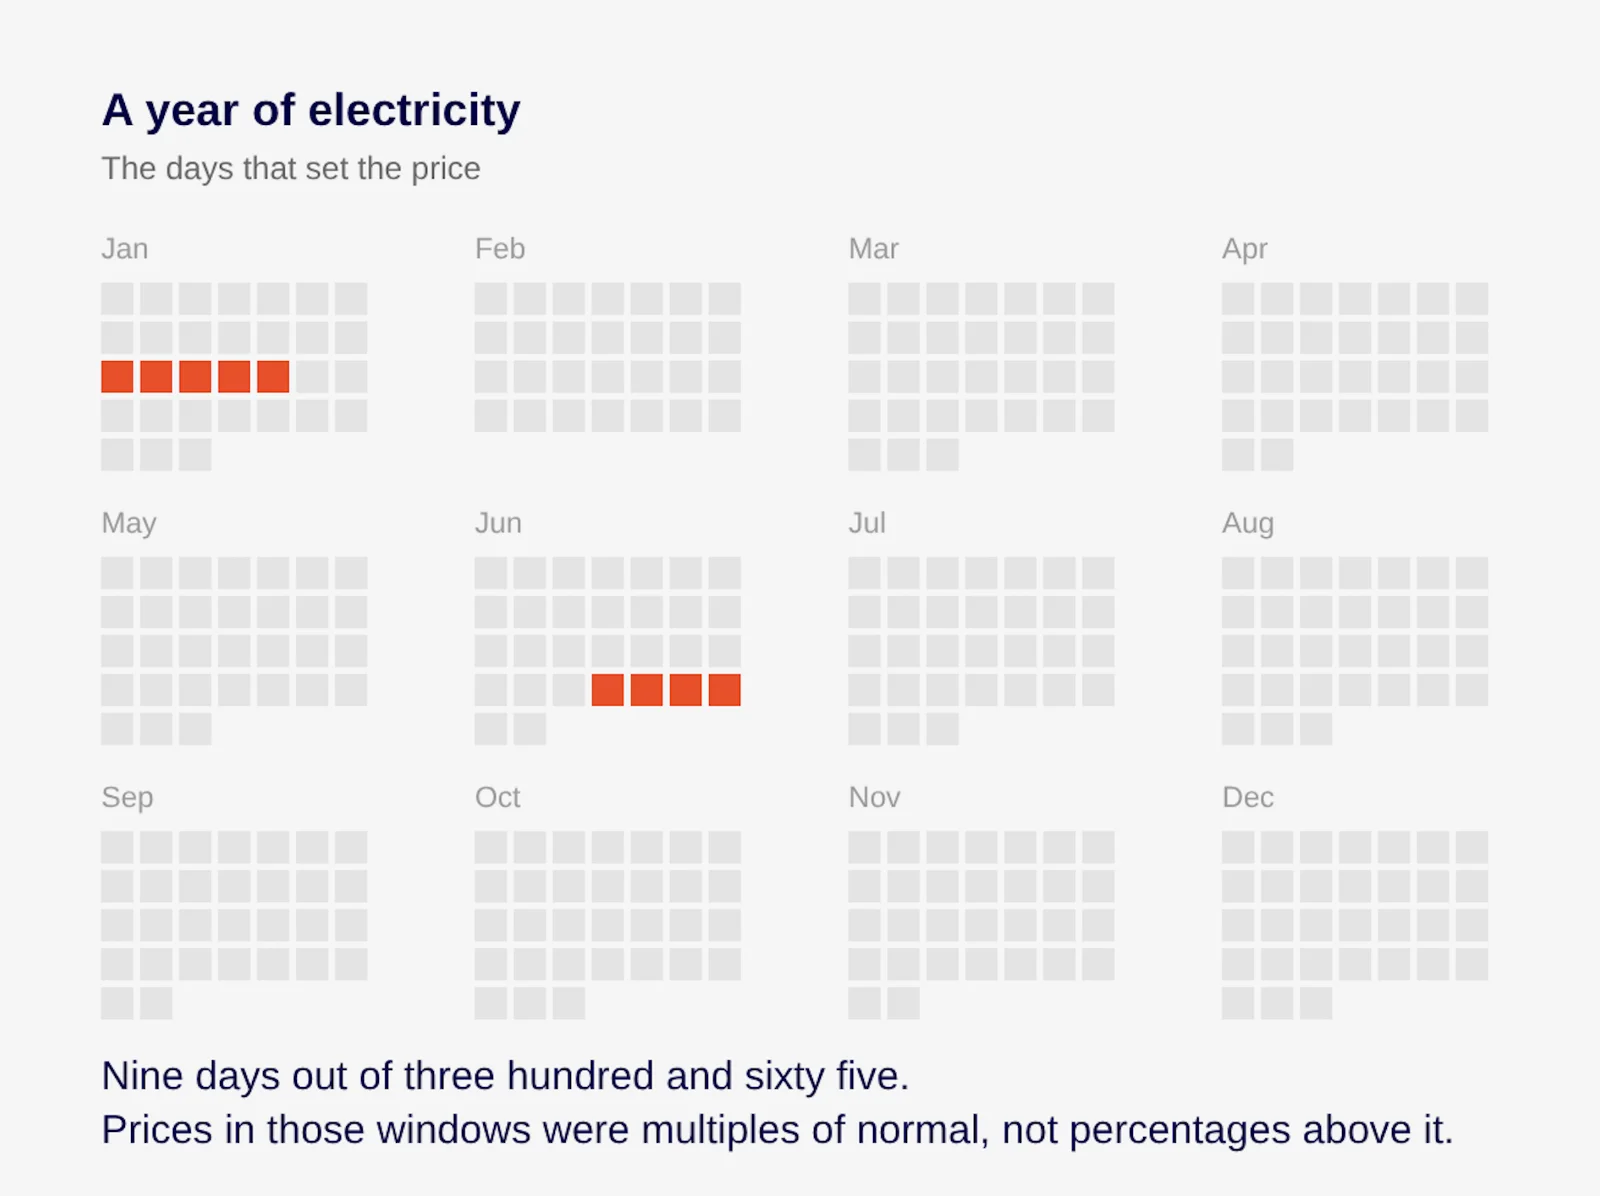
The first is that your exposure is concentrated in a handful of hours, and now you know which hours. They are the ones where regional scarcity and distant scarcity land on the same day. The January 2024 cold snap was five days. The June 2021 heat dome was about four. Prices at those moments were not 10% above normal, they were multiples of normal. The value of not consuming during those specific hours is therefore wildly higher than the value of general efficiency, and it is worth knowing in advance which of your loads could move if you wanted them to.
The second is that this is the actual argument for demand response programs, and it is a better one than the industry usually makes. The pitch is normally framed around helping the grid, which is true and which I have never once seen persuade a building owner to do anything. The version that should work is simpler: the grid is willing to pay you to not buy power at the moment power is most expensive, and the reason it is expensive is a heat dome sitting over the whole West Coast or a freeze in the Permian Basin.
Your utility is buying at those prices during those hours regardless of what you do, and the cost of it reaches you eventually through rates. Either you were paid to step aside, or you just paid.
Where we fit
Pilotlight is a compliance platform for building performance standards, which is not the same thing as a demand response program and I want to be clear about the difference.
What the two have in common is data. Everything in the last section depends on knowing what your building actually uses, when it uses it, and which systems account for the difference. That is the same information Washington's Clean Buildings Performance Standard already requires most owners over 20,000 square feet to collect and report. If you are benchmarking because the law says to, you are most of the way to knowing whether a demand response program is worth joining.
Owners usually treat compliance as a cost. The buildings that get the most out of it treat the resulting data as something they can use for other decisions, and this is one of those decisions.
If you are not sure whether your building is covered, our compliance navigator at pilotlight.ai/search will tell you in about a minute, and it is free.
Sources
- U.S. Energy Information Administration, Wholesale U.S. electricity prices were volatile in 2022
- U.S. Energy Information Administration, Western U.S. wholesale electricity prices reached highest levels since 2008
- U.S. Energy Information Administration, Winter storms have disrupted U.S. natural gas production
- U.S. Energy Information Administration, Weekly Natural Gas Storage Report Supplement, week ending January 28, 2026
- U.S. Energy Information Administration, Weekly Natural Gas Storage Report Supplement, week ending February 4, 2026
- S&P Global, Cal-ISO, utilities ask consumers to conserve amid record-breaking heat wave (June 2021)
- S&P Global, Natural gas spot prices soar as the US West freezes (February 2021)
- Northwest Power and Conservation Council, Hydropower (share of regional generation and flexible capacity)
- California ISO, Western Energy Markets Observations (June 2026)
- Seattle City Light, 2024 Annual Report (January 2024 wholesale purchase costs and record peak load)
- Unplugged: Dawn Lindell on the Grid Ahead, recorded at the Seattle Climate Innovation Hub (September 2026). January 2024 narrative is Dawn Lindell’s own account.