The Northwest Grid's Real Test Is a Cold, Dry Week
Planners say the Northwest's biggest grid risk is a multi-day cold snap in a low-hydro year. Here is what the numbers say, what the federal government has already done about it, and what buildings can do.
By Jeff Nichols
When people picture a grid emergency they usually imagine a heat wave. For the Pacific Northwest, the scenario that keeps planners up is the opposite: a cold stretch that lasts several days, in a year when the snowpack was thin and the rivers are low. The usual question is whether the region will have enough power on an average day. I think the better question is whether it will have enough during the worst week of the year, because that is the week planners actually build around.
I want to walk through what the regional modeling says, because the numbers are specific, and because this is a problem where buildings have a real role.
What the model says
In March 2026, E3 an energy consulting firm, presented a Phase 1 study on near-term energy and capacity needs to the Committee of State Representatives. E3 was retained by regional utilities and independent power producers, so read it as a model built by people with a stake in the answer, not as a forecast.
It estimates the Greater Northwest's effective capacity position year by year. In plain English: in the tightest hours, how much dependable supply the region has compared with what it needs.
- 2025: a surplus of about 1,221 MW.
- 2026: a shortfall of about 1,321 MW.
- 2027: about 3,354 MW short.
- 2028: about 5,046 MW short.
- 2030: about 8,689 MW short, almost 9 gigawatts.
By 2035 the gap grows to somewhere between 14 and 18 gigawatts. Resources already in development add about 3 gigawatts of effective capacity by 2030, which leaves a shortfall of roughly 6 gigawatts.
Demand is growing faster than the plan assumed
The February 2025 winter peak reached 35,700 MW, a new high that beat the forecast without an extreme weather event. The Northwest Power and Conservation Council's draft Ninth Power Plan, released in August, puts the current winter peak at 35,500 MW and projects it to reach 47,000 to 60,000 MW by 2046. Annual energy use is projected to grow from about 22,000 average megawatts today to between 31,000 and 44,000, an increase of 50 to 100 percent over 20 years.
The Council expects that growth to come first from data centers, and then from electrification and long-term economic and population growth. The E3 study names the same drivers, along with electric vehicles and manufacturing, and it adds that older plants, mainly coal, are retiring faster than new ones are opening.
Why a cold, dry week
The sharpest point in the E3 deck is about timing. About half of the region's energy comes from hydropower, and nearly all of the modeled reliability events happen in very low-hydro years. The study says the region's biggest challenge is a multi-day cold weather event during a low-hydro year, with cold snaps lasting 50 to 100 hours. That duration is what makes these events hard to plan around. A battery can carry a system through a few hours of peak demand, which is genuinely useful, but a cold stretch that runs four days is a different kind of problem and the region does not currently have a good answer for it.
The North American Electric Reliability Corporation frames it the same way. Its 2025 to 2026 Winter Reliability Assessment found that every assessment area, this one included, has adequate resources for a normal winter peak, and that the exposure appears when extreme conditions extend across a wide area for a sustained period. That is the same distinction the E3 study draws, and it is why a normal cold snap is not the thing to plan around.
The longer view is sharper. NERC's Long-Term Reliability Assessment, released in January 2026, rates the WECC Northwest region at high risk of energy shortfalls beginning in 2029, and projects regional peak load rising 6.6 gigawatts, about 19 percent, over the next decade. Its modeling shows that natural gas, wind, and hydro output can all drop at the same time in severe cold, and that is exactly when reserves run thin.
The clearest evidence is not a model
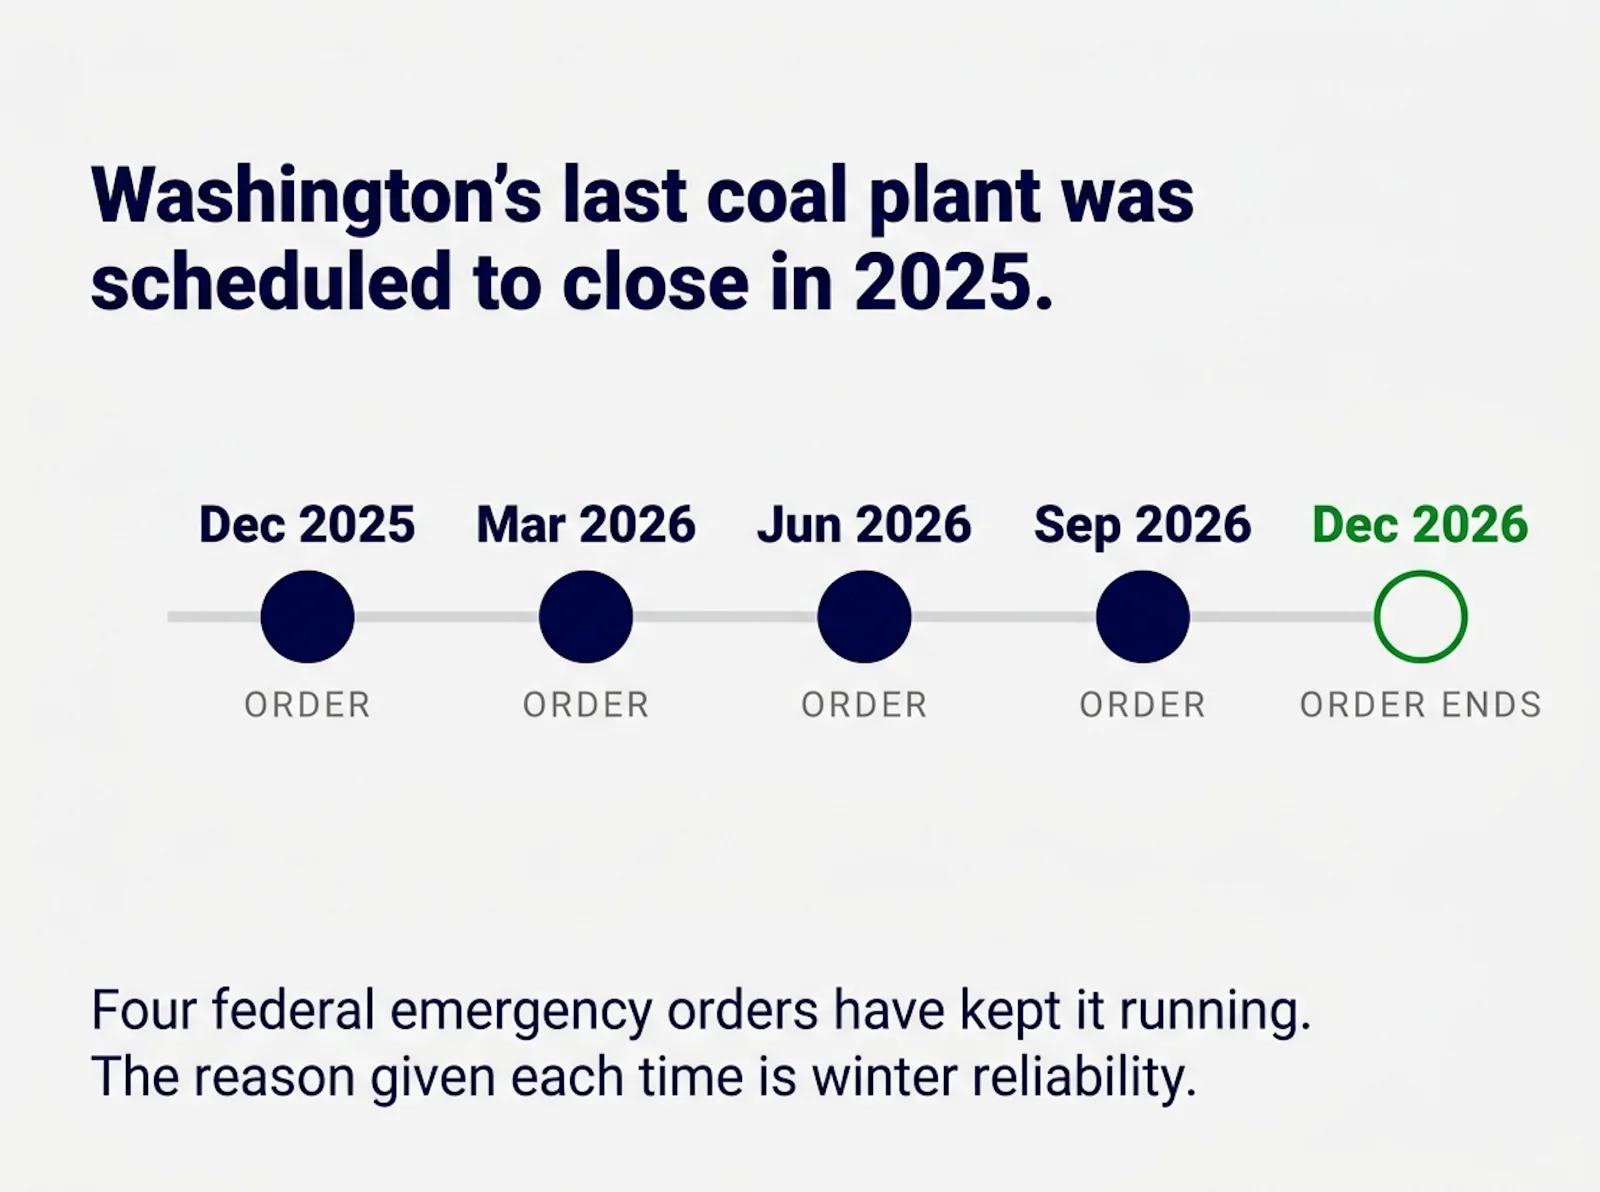
If you want to know whether anyone takes this seriously, look at what has happened to Washington's last coal plant.
Centralia Unit 2, a 730 megawatt coal-fired unit in Lewis County, was scheduled to shut down at the end of 2025... it's still running. The U.S. Department of Energy has issued four emergency orders keeping it available to operate, in December 2025, March 2026, June 2026, and again in September 2026. The current order runs through December 11, 2026.
The orders cite the same material covered above. DOE's December order quoted NERC's finding that the WECC Northwest region faces elevated risk during prolonged cold snaps, its June order quoted the Long-Term Reliability Assessment's high-risk rating, and the reasoning in both names the E3 study directly.
I'm not arguing about whether keeping a coal plant open is the right answer, and there is active litigation over these orders. The point is narrower. When a federal agency repeatedly overrides a planned retirement and says the reason is winter reliability in this specific region, the gap in the models has stopped being hypothetical.
What a cold week looks like from inside a utility
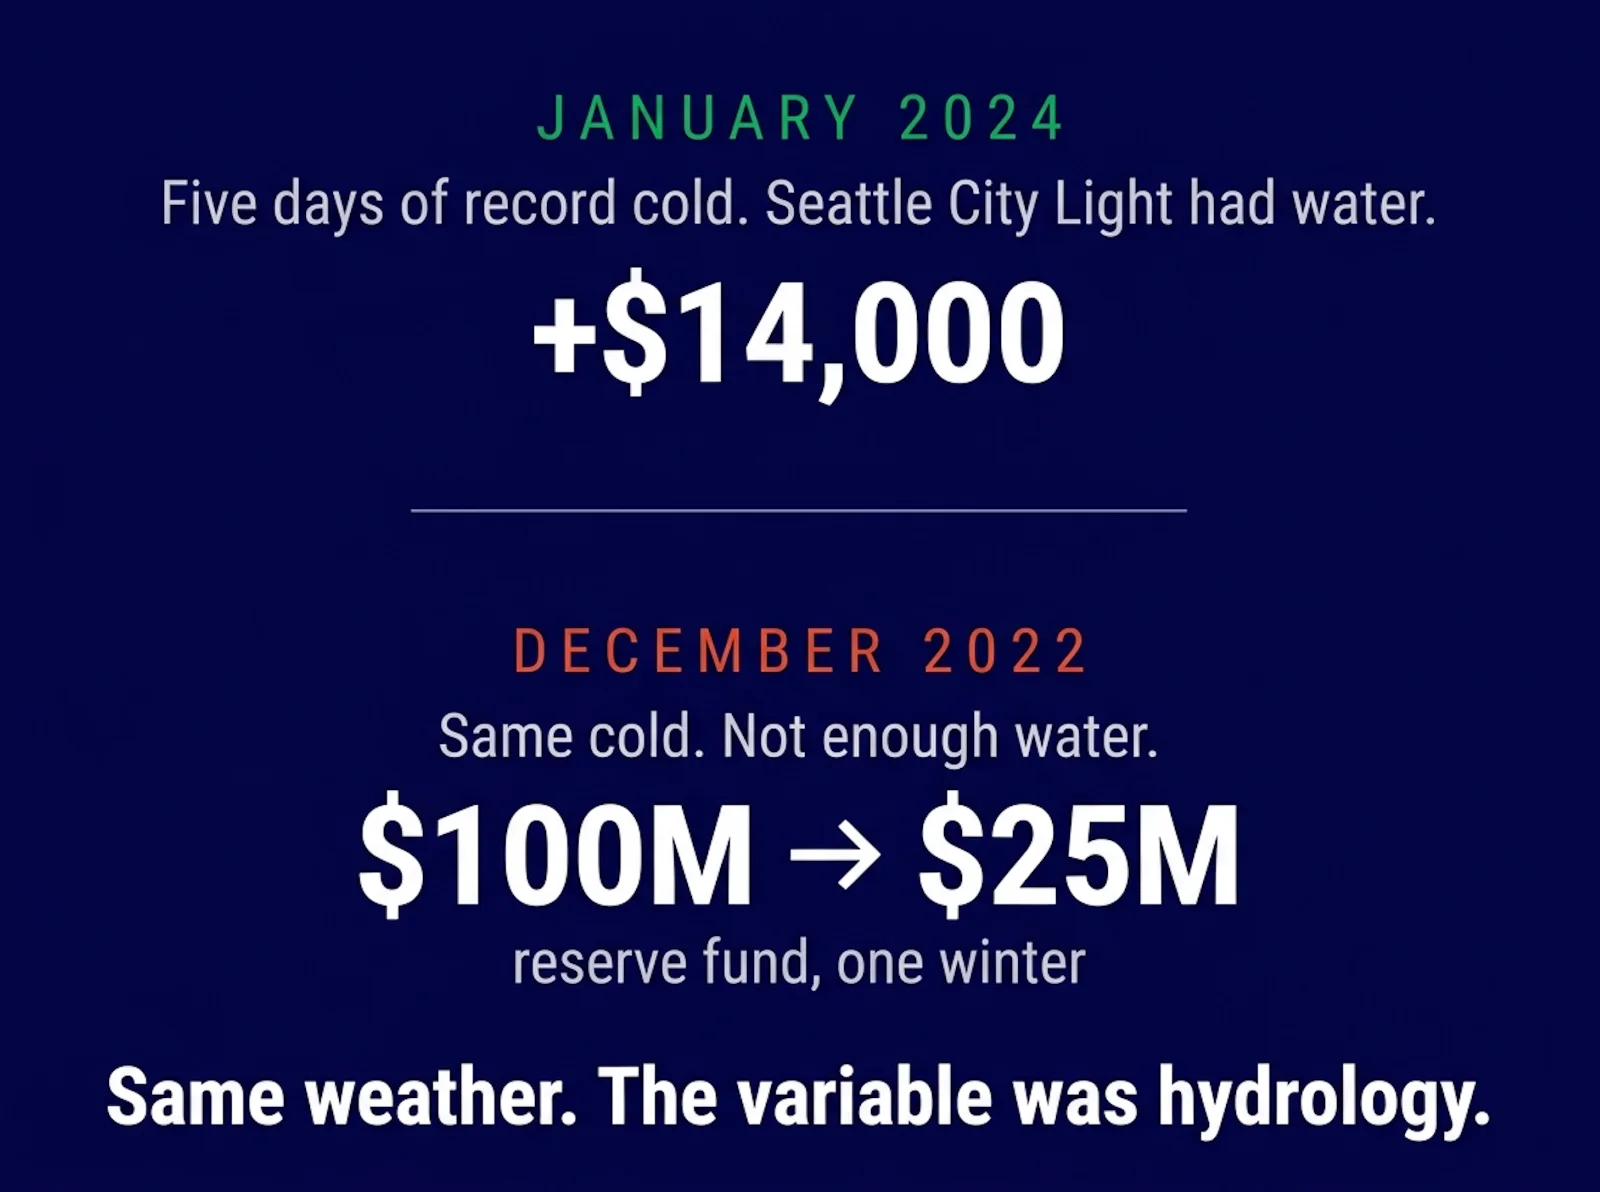
At the Unplugged event I hosted in September, Dawn Lindell, the former CEO of Seattle City Light, walked the room through the five-day cold spell over Martin Luther King Jr. weekend in January 2024. Seattle City Light's load set a record of more than 2,400 MW, roughly double its normal load of a little over 1,200. A key north-south transmission line owned by the Los Angeles Department of Water and Power was out of service, which congested the other lines, and utilities across the region were bidding against each other for power while prices climbed.
By Dawn's account, neighboring utilities spent $50 million to $100 million on five days of buying generation. Seattle City Light's power team used water carefully and planned ahead, and the utility finished the event about $14,000 ahead. Dawn was quick to add the other half of the story: "we got lucky because we had water." Her neighbors did not, and she said it could happen here.
A different winter went the other way. In December 2022 there was a cold spell and not enough water, so Seattle City Light had to buy on the market. Their $100 million reserve fund fell to $25 million, but has since been rebuilt.
That is the E3 scenario in miniature: the same cold, with and without the hydropower to cover it.
Dawn also offered a useful counterweight on what is driving the load growth. She pointed out that the region set a new record in February 2025 with no major weather event, and that in her experience most of that growth has little to do with data centers. In her telling it is transportation electrification, building electrification, and local growth. The Council puts data centers first. I would treat those as two vantage points rather than a settled disagreement, but it is a reminder that the people living with the load every day see a broader picture than the headlines do. It is also why one of Dawn's slides stuck with me. It showed the average daily market price across the West from 2001 to 2025, which averaged about $40 per megawatt hour, with spikes for the California heat waves, the Texas freeze, and the 2021 heat dome. Her read was that weather events in other states show up in Northwest costs, and that the last five years have been far spikier than the twenty before them.
What the Council proposes
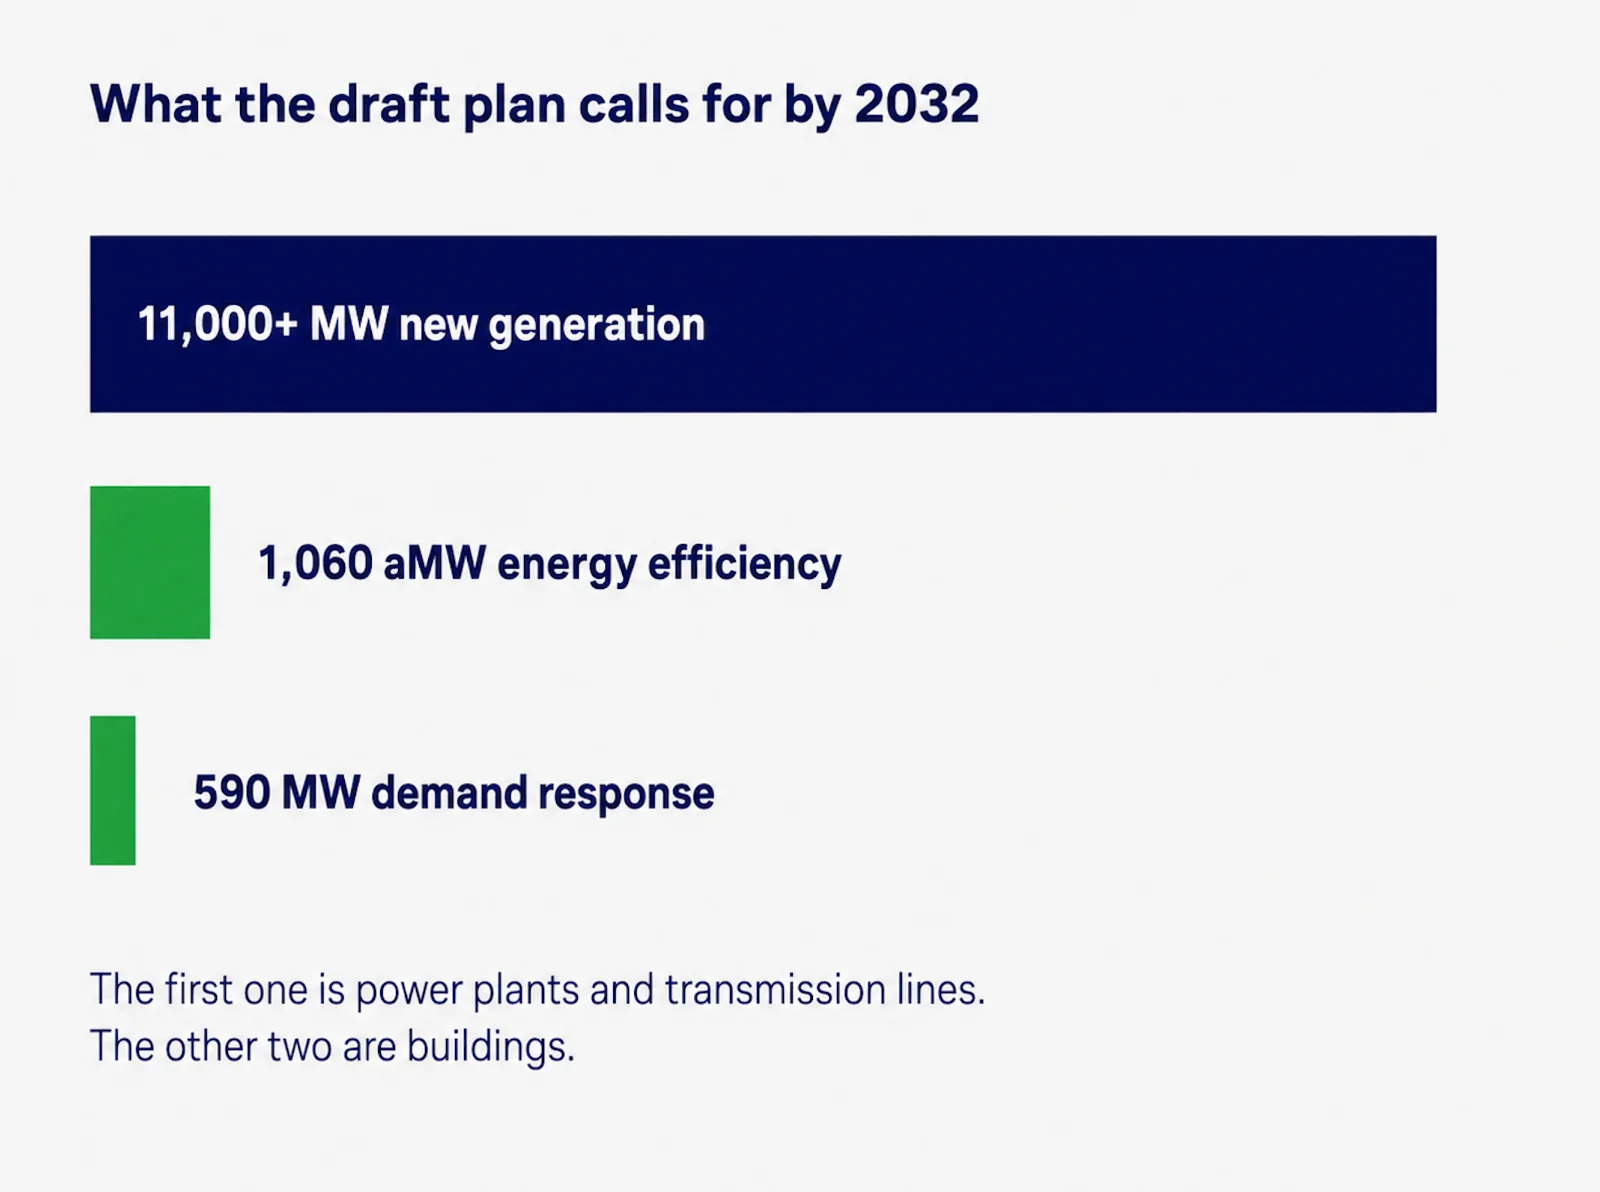
The draft Ninth Power Plan lays out a resource portfolio for 2027 through 2032. It calls for:
- 1,060 average megawatts of energy efficiency, including 860 in Oregon and Washington.
- 590 MW of demand response.
- More than 11,000 MW of new generation, including about 9,000 MW of renewables and 2,100 MW of natural gas.
- 5,000 MW of storage.
The Council estimates the fixed cost of the 2032 portfolio at about $2.3 billion, which is roughly 0.15 percent of the four-state region's 2025 economic output. It held public hearings in September and October, including one in Seattle on October 7, and it aims to adopt the final plan by the end of 2026.
Notice how much of that list is not a power plant. Efficiency and demand response are both named resources in the plan, and they are resources that sit inside buildings.
What demand response actually looks like
Demand response means paying or pricing customers to use less at the moments the grid is tightest. It sounds new, but it has a track record. At the Council's August meeting, panelists reported that the region had acquired more than 800 MW of peak demand savings capacity as of 2025.
Puget Sound Energy has over 100 MW of demand response capacity and more than 600,000 participating customers across five programs. In August, day-ahead prices topped $150 per megawatt-hour, which triggered the utility's first summer deployment. PSE's Josh Jacobs told the panel that for more than 20 years the company could not make demand response pencil out because supply was so cheap, but that this has changed.
Dennis McLerran, Seattle City Light's deputy general manager, made the affordability point. When customers shift their usage, their monthly bills can drop, and the grid needs less peak capacity.
What this is not
It is not a prediction of blackouts. Models test what happens when conditions line up badly, and those conditions are rare. E3's own next phase will look at least-cost combinations of resources for reliability and clean energy goals through 2045.
And planning does make a difference, as the Seattle City Light story above shows, even if luck with water was part of it.
It is also worth being honest about scale. The draft plan's 590 MW of demand response is a fraction of the roughly 5,000 MW that E3 models as the 2028 gap. These are different studies with different definitions, so I would not subtract one from the other. But the comparison tells you demand response is one tool among several, not the whole answer.
Where buildings come in
Cold weather is what pushes the region's winter demand up, and much of that demand is buildings keeping people warm. That puts building owners in a position to help, in three practical ways.
The first is to use less. Efficiency is a core resource in the draft plan at 1,060 average megawatts, and unlike generation it needs no new transmission to deliver.
Dawn's caveat is worth keeping in mind. Seattle has led the nation on conservation, she said, but the easy savings are done. Adding new conservation to offset new load now means replacing equipment like a refrigerator before it dies, not changing a light bulb, and that takes longer. For a building owner that is an argument for starting with operations, where the savings do not wait for an equipment cycle.
The second is to shift when you use it. Seattle City Light's residential time-of-use rate went live on May 5, and staff at the event described it as the first rate option in the utility's history. It prices electricity highest from 5 to 9 p.m., and Dawn explained why that window matters: people get home, the lights, TVs, and computers go on, dinner is cooking and laundry is running, and the sun is setting just as solar falls off. On September 23, the utility opened an optional time-of-use rate to small and medium businesses. Peak hours are 5 to 9 p.m., Monday through Saturday. Mid-peak runs from 6 a.m. to 5 p.m. and from 9 p.m. to midnight, and off-peak is midnight to 6 a.m. every day. Customers can compare rate estimates in the utility's Energy Insights tool before they sign up, and the utility notes the rate may not suit every business. A building whose schedule can move a few hours is the one that benefits.
What can move depends on the building. Typical candidates are water heating, laundry and kitchen equipment, electric vehicle charging, and the start times for heating and ventilation schedules. A morning warm-up that finishes before peak hours begin at 5 p.m. is a different load shape than one that runs straight through them. None of this is about asking anyone to be uncomfortable, it is about finding the loads where the timing does not matter to the people inside the building.
Many of those fixes cost little or nothing. At the Energy Efficiency Exchange in Boise this spring, Clark Korbisch of Power TakeOff made the case that planning should start with low-cost and no-cost operational improvements before any capital retrofit, because they can shrink the scope of later work. A schedule change is the cheapest kind of grid resource there is.
The third is to know your own numbers. A building that tracks its energy by month already has what it needs to see how heavy its winter load is. That is the same benchmarking data that building performance standards ask owners to collect, so owners doing that work already hold much of the data they would need to evaluate a demand response program.
None of this replaces new power plants and new lines. But the gap above is measured in megawatts, and some of those megawatts are sitting in the thermostat schedules of buildings that already exist.
Which means the question facing the region is not only what it builds next, but what it does with what it already has standing. Use less. Shift when you use it. Know your numbers.
If you would like help figuring out where your building stands, I am always happy to talk it through.
Sources
- E3, Phase 1 Study: Near-Term Energy and Capacity Needs, presented to the Committee of State Representatives (March 27, 2026)
- Northwest Power and Conservation Council, Draft Ninth Power Plan (August 13, 2026)
- Northwest Power and Conservation Council, Panel discussion explores growing role of demand response in the Northwest (August 27, 2026)
- NERC, 2025-2026 Winter Reliability Assessment (November 2025)
- NERC, 2025 Long-Term Reliability Assessment (January 2026)
- WECC and NERC, Resource Adequacy presentation to the Washington Utilities and Transportation Commission (November 2025)
- U.S. Department of Energy, Emergency Order No. 202-26-18, Centralia Generating Station Unit 2
- U.S. Department of Energy, Energy Secretary Keeps Coal-Fired Power Generation Alive in the Northwest (June 12, 2026)
- Seattle City Light, Time of Use Rate for Small and Medium Businesses, via the Peak Load Management Alliance (September 24, 2026)
- Unplugged: Dawn Lindell on the Grid Ahead, recorded at the Seattle Climate Innovation Hub (September 2026). Figures are Dawn Lindell’s own statements.